Section 5 - A Summary of the trips and journeys undertaken by Community Transport
Just as CTOs provide many different types of services, so the number of number and character of trips are determined by the type and size of the organisation, the passengers being taken and the environment that the CTO is operating in. Respondents were asked to provide top-line figures for their monthly operations.
In total, 166,882 monthly trips were being made by 186 responding organisations. If expanded to the overall CTA membership this produces a total of nearly half a million trips per month and 5.8 million trips per year.
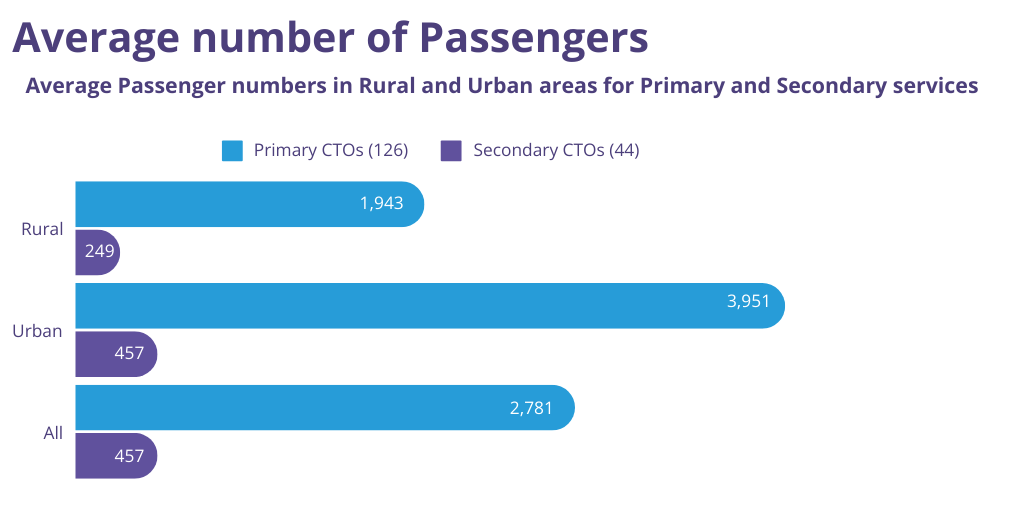
On average CTOs were carrying 2179 passengers per month. Factoring up the average number of passengers to the overall CTA membership, gives a monthly estimated total of over 1 million passengers carried, with 13.8 million passengers taken annually.
Crucially these figures show how CTOs are responding to different types of transport in different areas. Organisations operating in rural areas were likely to be making fewer trips, with fewer passengers, with a longer average trip distance due the more dispersed nature of their service area. The dispersed nature of demand is the chief difficulty for rural group travel and frequently the reason why commercial operators are not providing services in these areas.
Equally secondary purpose organisations are traveling less often than primary purpose CTOs, with longer distance trips for fewer passengers.
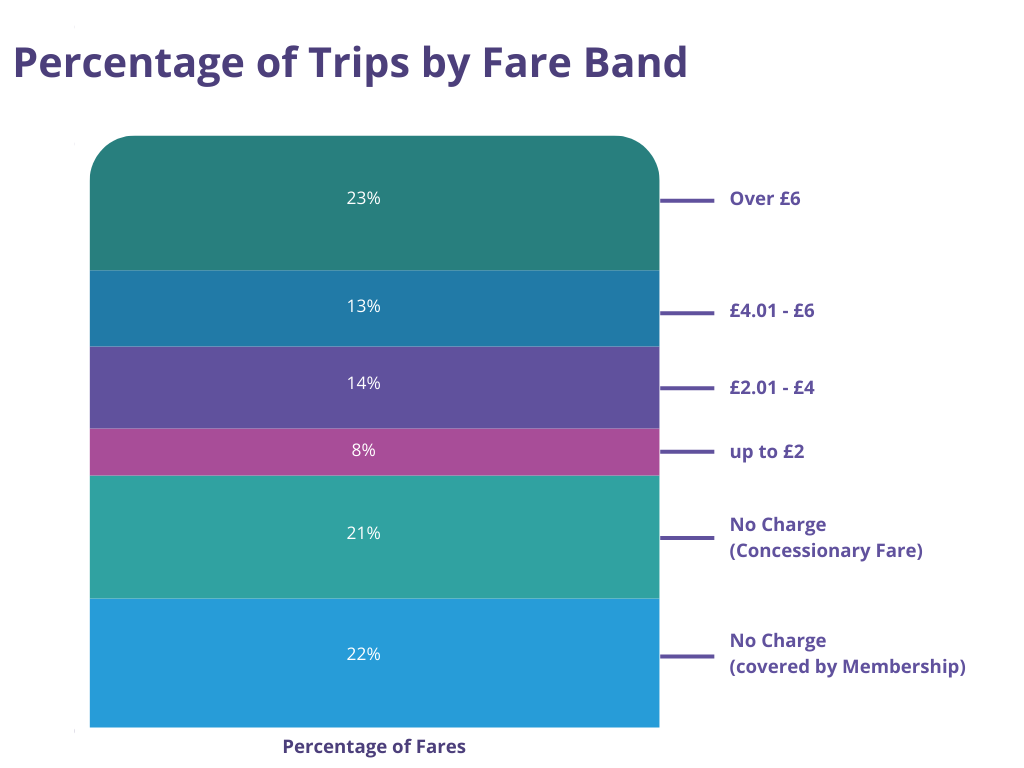
In terms of fares, 43% were not directly charged, with cost either covered by membership or a concessionary pass. Almost a quarter of fares cost over £6.
CTA will continue to work with CTOs to show the details behind these figures, for example supporting the valuable work by Ealing Community Transport in developing and updating their Social Value toolkit, as well as working with the sector to enable trip data to be collected and shared with local stakeholders more easily.
To access the full breakdown of journeys and trips delivered by Community Transport read the full report here
See the next section in the Mapping England report below
Mapping England
Mapping England: State of the Sector Community Transport Report 2024 Discover the Latest Insights on England’s Community Transport Sector We are excited to share with you the Mapping England: State of the Sector Community Transport Report… Read more